Calibrating and Verifying Tactile Pressure Sensors
The considerations, complexities and methodologies of tactile pressure measurement
Tactile Pressure Sensing Overview
Tactile sensing involves measuring the force and pressure distributions across an area between two surfaces in direct, physical contact. However, while the common measurand terms of force and pressure may be used, the mechanics of the application are often much more complex.
Pressure is a scalar value and defined as the force over a specific area. Force can be considered a vector with a particular magnitude and direction. Traditional single axis force measurement devices such as load cells can incorporate precision flexures to concentrate the contact to a single, well-controlled point where one or more of the three directional components can be isolated and measured.
However, when considering thin and flexible tactile pressure sensors it is the interaction between the two surfaces that are trying to be captured and therefore these complex measurements must be made at the surface interaction boundary while minimizing the effect and intrusion of the sensor itself on the overall application.
This means that accurately designing, calibrating and verifying the performance of a tactile sensor is a challenging undertaking and requires careful consideration. This document is intended to serve as a guide for better understanding both the parameters that affect the calibration and that of the process and end result itself.
Tactile Sensing Technologies
All current commercial tactile sensing modalities are on the whole based on measuring one of two fundamental electrical properties: resistance or capacitance.
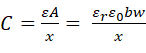
The development of PPS sensor technology began in the Harvard Robotics Laboratory in the early 1990’s with the goal of enabling robots with the “Sense of Touch”. The technology focused on capacitive based tactile pressure measurement, where two distinct metal conductors separated by an insulating dielectric form the capacitor.

The capacitance (C), measured in Farads (F) of a simple planar capacitor is given by Equation 1:
Where:
Width of conductor plate (w) (mm)
Depth of conductor plate (b) (mm)
Area of the plates (A) (mm2)
Displacement between parallel plates (x) (mm)
Permittivity of dielectric (e) (F m –1)
Permittivity of free space (e0) (8.85´10 –12 F m –1)
Relative permittivity (eR) (dimensionless)
A force on one or both of the conductor plates, causes a change in displacement (x) between the parallel plates which therefore results in a change in the capacitance which can be electrically measured and quantified, allowing input pressure to be inferred from this value. The deflection of these plates (typically in the order of 50 mm) leads to very high sensitivity, repeatability and stability over time.
As the varying sensor parameter is in-fact the displacement between the plates (x), the variation of capacitance with respect to this displacement is non-linear due to the location of the parameter in the denominator of Equation 1.
Therefore a typical uncalibrated PPS tactile sensor will have a response curve that is inherently non-linear, with a higher sensitivity at low pressures and lower sensitivity at higher pressures. This non-linear nature gives the dual benefit of good sensitivity at low pressures while allowing a higher full-scale range.
As measuring capacitance is more difficult than measuring a change of resistance, capacitive sensors have historically been more complex and costly while also featuring a lower scan rate.
It is worth noting that PPS has researched and developed a number of proprietary dielectric spacer materials with varying relative permittivities to achieve optimum sensitivity and mechanical pressure measurement performance across the scales between low and high pressures .
Sensing Arrays
In order to produce a larger sensing and mapping area with multiple individual elements requires array topologies and design. Considering a simple square 2D area, individual metallic rows and columns can be laid perpendicularly to each other with a common dielectric material spacer. At each overlapping region of each row and column a single capacitor and hence sensing element is formed. Through patented sensing topologies each distinct capacitor and elements can be sensed and measured. Arrays of thousands of elements can and have been produced through this technique.
In addition to better fundamental sensing performance and greater design flexibility when compared to competing pressure mapping techniques, advances in commercially-available capacitive-sensing ICs and manufacturing techniques have made capacitive tactile sensing a technically superior technology for precision measurement and mass production in products ranging from mobile phones to medical devices. PPS’s core patented technology has focused on the research and development of multi-element count arrays to allow quantifiable pressure measurement and distribution across an active impact area. Such technology has been utilized in multiple applications in sectors such as manufacturing, medical, automotive, ergonomics and instrumentation solutions.
Calibration
Calibration is required because measurement instruments cannot be manufactured free from effects of inevitable tolerances and the cumulative effect of these tolerances in mechanical and electrical components cannot be accurately prediction during design. Calibration is therefore the process whereby actual values of input measurand are used to derive accurate output values of a desired format. Immediately after calibration, errors are acceptably small at least for those values of measurand for which calibration has just been performed.
However, errors arise subsequently because measurement systems may not perform exactly the same at time of measurement and during calibration for example due to:
· The performance of the measurement system may have changed with time (drift, ageing, wear).
· Environmental influences maybe different than during calibration (most important environmental influence is usually temperature).
· Assumptions made during calibration may not be valid.
· The instrument may be operated outside range of operating conditions for which model is appropriate.
· Procedures and equipment employed during calibration may not have been of sufficiently quality (traceable to national standards).
Overview of Tactile Sensor Key Parameters
It is important to understand and consider the parameters used to define capacitive based tactile pressure sensors.
Full Scale Range (FSR)
FSR describes the maximum pressure measurement range over which a tactile sensor is calibrated and designed to be used.
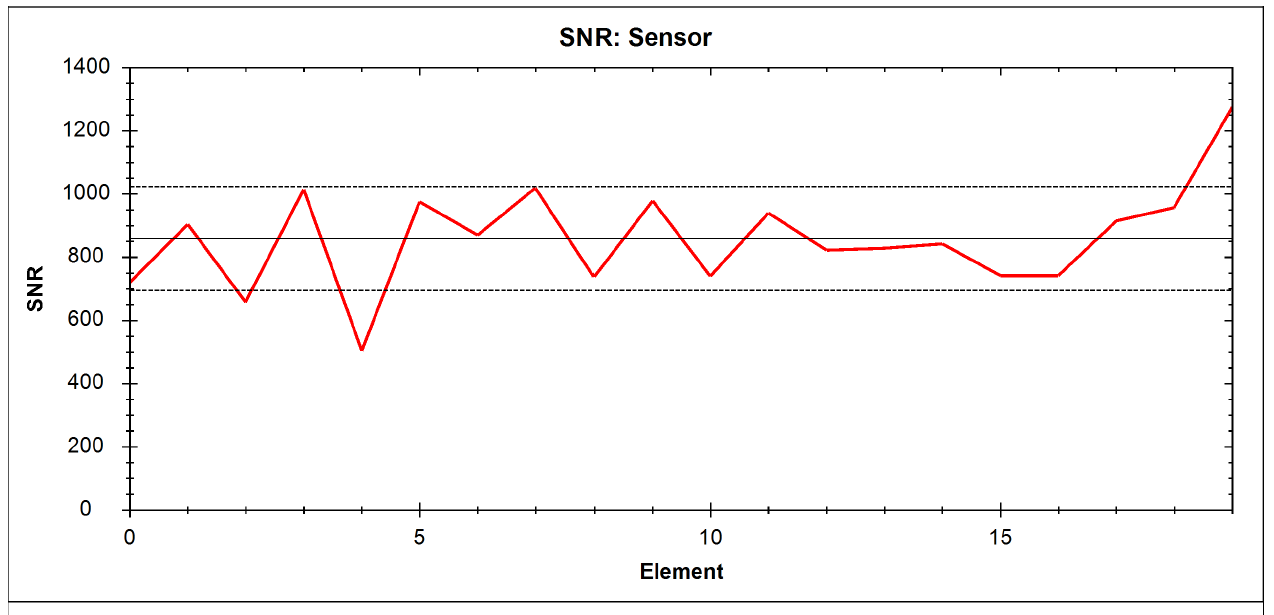
Signal to Noise Ratio (SNR)
SNR captures the raw signal at Full Scale Range divided by the Root Mean Square (RMS) noise when unloaded. This measurement provides an indication of how fine of pressures that the tactile sensor can resolve when operating. PPS tactile sensors typically feature a minimum SNR of 300:1 and can be high as 2000:1 highlighting their unique high resolving power.
Pressure Sensitivity
The pressure sensitivity determines the minimum pressure interval that the tactile sensor is able to detect based on the RMS noise of the calibrated, unloaded output. For typical PPS capacitive based sensors, the minimum sensitivity is found to be 0.2% of sensor FSR.
Minimum Pressure Detection
Some sensor technologies will advertise a minimum detection threshold because they cannot achieve their full pressure sensitivity at low pressures and require sufficient force to begin measurement. PPS capacitive tactile sensor designs do not have such a restriction, which means the minimum pressure detectable is the same as pressure sensitivity.
Resolution
Resolution is defined as the Full Scale Range divided by the measured Signal to Noise Ratio and defines the resolving power of the sensor.
Repeatability
Repeatability is defined as the variation in multiple measurements of the same applied pressure under the same ambient conditions over a series of load cycles. PPS regard this as an important performance metric to ensure reliable, stable, and consistent data.
Gain Repeatability
Gain Repeatability is defined as the variation in multiple measurements of the same applied pressure under the same ambient conditions over a series of load cycles after compensating and removing for any baseline sensor drift.
Baseline Repeatability
Baseline Repeatability is defined as the variation in sensor baseline output when returning to a zero-load level under the same ambient conditions over a series of applied cyclical load cycles.
Linearity
Linearity quantifies the quality of calibration by comparing the calibrated output of each element within a sensor under a series of known loads to the performance of an ideal sensor system. An ideal sensor would feature a linearity of 100% while PPS sensors typically feature linearity of 99.5% or higher.
Accuracy
The accuracy of an instrument is defined as the difference between the true value of the measurand and the measured value indicated by the instrument. When considering thin and flexible in-situ tactile measurement the measured accuracy of a tactile sensor is dependent on the overall measurement application and setup, specifically parameters such as contact mechanics and the operating environment. Given that such information varies widely between customer applications, PPS defined and report sensor accuracy under controlled laboratory conditions which are often more stringent than the final application.
Spatial Resolution
The spatial resolution of a tactile sensor is dependent on the physical size of the individual sensing elements and the pitch between such elements defining the element density over an area. Spatial resolution dictates the minimum physical features which may be detected and captured over an area. PPS capacitive sensors are designed to minimize the gap between physical elements, and the unique compliant layers cause the load to distribute across the gaps, effectively enabling continuous coverage over the active sensing area. Element size is a compromise between many parameters such as the ideal spatial resolution, area coverage, element count, particle size, minimum sensitivity, data processing, communication and sample rate.
Contact mechanics, such as firstly the ratio between the contact area of an applied force and the individual element, and secondly the location of that applied force on an element are critical to understand and consider when discussing application accuracy. For example, a load with large surface contact area covering many individual elements will ensure the top electrode of loaded elements will deflect linearly downwards and hence each sensing element will behave as expected. However, a very small point load, acting on an individual element with larger area will result in deformation of the top electrode of that element and as such it will not deflect linearly downwards, resulting in an application specific error based on the surface to surface contact mechanics. This is an important consideration when understanding and defining tactile sensor accuracy.
Capacitance Measurement
Measuring capacitance requires a complex mix of digital and analog circuitry and typically all capacitive tactile sensors utilize a Capacitance to Digital Convertor (CDC) architecture whereby raw capacitance is measured and converted to a corresponding unit defined as number of “counts”. Small capacitances are represented by a lower number of counts while conversely higher capacitances are characterized by a larger number of counts.
Sampling Rate
As mentioned, measuring capacitance requires complex CDC circuitry and typically such systems have limitations in scan rate. For reference, typical PPS tactile sensors scan and sample all elements across an array at rates of 10-200Hz. For the vast majority of tactile sensing applications, such as those involving human-machine interfaces where events happen on the order of a few hertz, this limitation is not a problem. This sample rate limitation means that capacitive tactile sensors are not suited to high speed impact application where events happen in micro and millisecond timeframes.
Designing, Manufacturing and Calibrating a Tactile Pressure System
In an ideal world, all measurement sensors would have the exact same response and output to a given input. When considering a multi-element tactile pressure sensor where every element is loaded with a defined force, each individual element would also produce the same output in response. Unfortunately, when considering both the minute nature of the electrode deflections along with manufacturing variations and processes such uniformity is extremely hard to achieve. For example, when considering an uncalibrated tactile pressure sensor array, an applied load of 1 psi across all elements might produce an output of 2,500 counts from one element and 2000 in another. To account for these disparities and reduce overall system error it is necessary to calibrate each and every element within a tactile array system.
It is important to also remember that the multiple electronic array measurement channels feature inherent tolerances and variations between channels and therefore when we discuss and undertake calibration we must calibrate both the sensor array and corresponding electronics. Only through this approach can the full measurement system be calibrated and errors reduced to a practical minimum.
Calibrating a Tactile Pressure Array
To ensure optimum system accuracy it is widely acknowledged that each element within an array requires its output verified against a well defend applied load. The challenge of ensuring uniform applied pressure across the area of an individual element is of paramount importance and requires extremely careful consideration – Without this the calibration and hence accuracy of a pressure system is severely compromised.
For example, consider a simple weight of know mass and certain geometry. One might reasonably assume that by placing the weight on a sensor would apply a known load and hence pressure to the system. This method is fundamentally flawed for two fundamental reasons:
Firstly, the applied pressure across the loaded elements is often not actually uniform due to the fact that every surface has a specific flatness and roughness, and the bottom surface of a weight is no exception - The small surface variations result in the weight applying peak pressure on the sensor at specific locations and far less pressure in other areas. If surface features are particularly pronounced and rough, the peak contact pressure can be found to be far higher than expected as the mass force is now being applied over a very small area and this can lead to saturation in the sensor, which can result in errors.
Secondly, the concept of the importance of the ratio of area contact and sensor elements is critical. For example if the mass bottom surface is of a shape that is smaller or different shape to the smallest element of the sensing array, the loaded element top electrode will not be fully loaded and displace linearly. Furthermore, if the mass features a large surface contact area that covers many individual elements, the importance of mass to sensor positioning is important to ensure that elements measuring under the perimeter of the mass are not partially loaded.
One possible approach to counteract both of the above challenges is then to apply a layer of compliant material such as foam between the weight and the sensor to ensure that the pressure is distributed more evenly across the elements in question and average out the surface roughness effects. This brings its own challenges, of course. If the foam is too hard, it will act much like the rigid weight and feature its own surface contact mechanics effects and if the foam is too soft, it may bottom out, negating the benefit of having the foam there at all. Rubber materials compress more effectively than foam, but it, too, can cause complications, namely by gripping the sensor as it compresses and its tacky nature result in complications when performing measurements where loads are applied, removed and reapplied. PPS has had success using leather as a calibration material, especially when working with high pressures, as the leather is strong enough to remain intact, but also compliant enough to distribute the pressure evenly.
However in a sustained drive to improve the calibration and hence performance of tactile pressure sensors especially at low pressures, PPS developed an even more consistent method utilizing the use of a thin proprietary material formed into a bladder and housed within a specifically designed calibration chamber. An uncalibrated tactile sensor is inserted into a chamber and the bladder inflated with air pressure to the desired sensor FSR pressure, referenced to a NIST air pressure sensor, and thus a uniform pressure applied to each and every element of the sensor. The key design parameter of the bladder-based system is that the pressure in the bladder equals the pressure applied to the surface with zero pressure drop across the bladder. This assumption only remains valid as long as there is minimal surface to surface tension in the bladder and the bladder is thin and soft enough to conform with negligible compression – PPS believes its sustained research and development of this specific procedure ensures that each and every element of every array is calibrated with the highest pressure uniformity and lowest effects of surface to surface contact mechanics.
This process and method can be tailored to the sensor geometrical design and also the FSR of the tactile array. For example, PPS has developed multiple calibration chambers of varying shape and sizes to suit varying sensor geometries while the lower the desired FSR, the thinner the bladder.
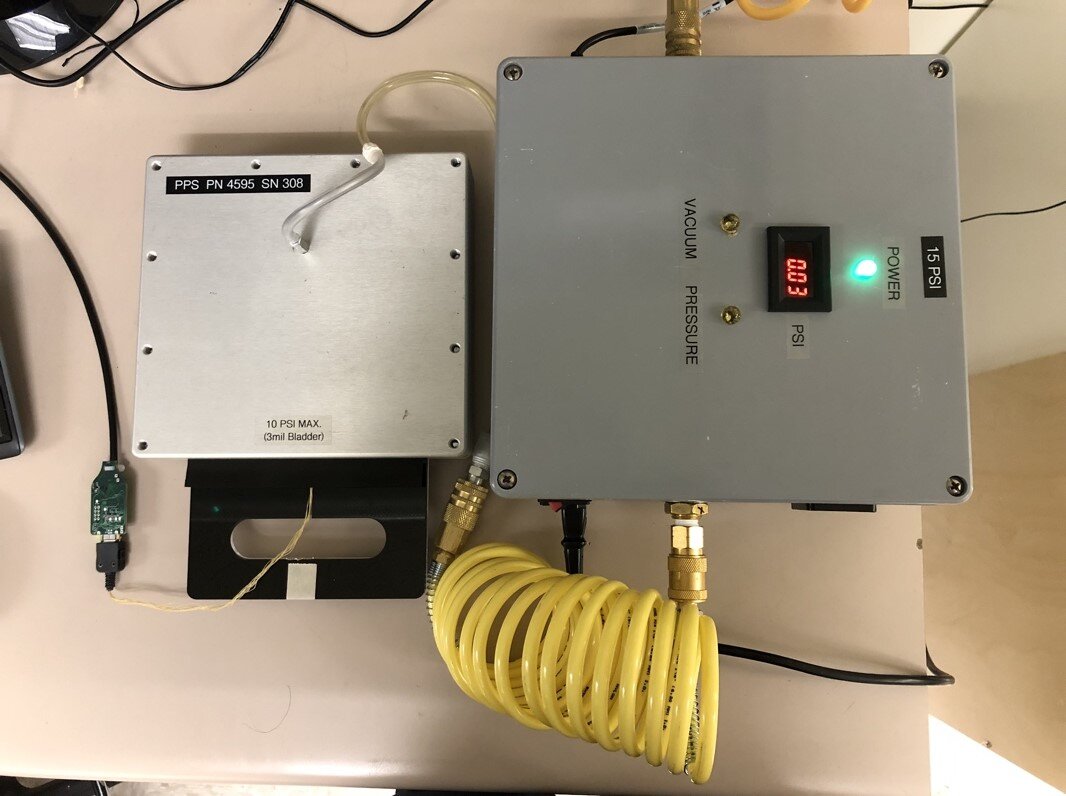
Figure 3 - PPS Pressure Calibration Chamber & Controller
Bladders can range in size from 30mm to over 1m. There pressure range can go from 5psi to hundreds of psi.
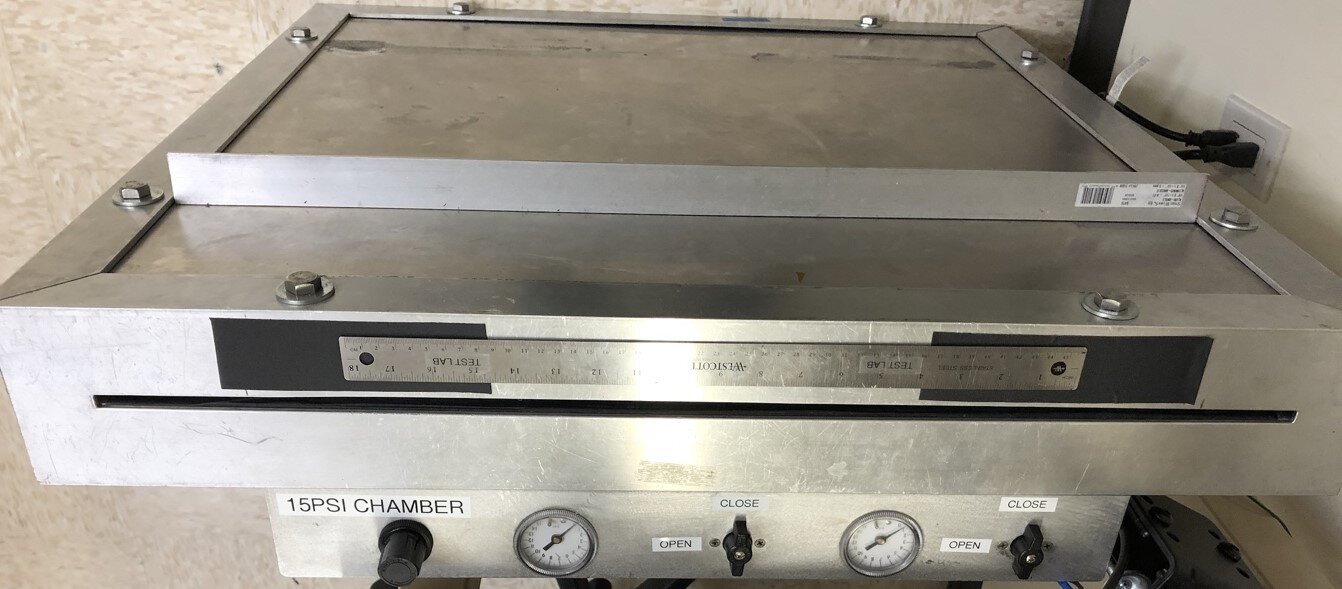
Figure 4 - Large Area Calibration Chamber
When considering mounted sensors, on specific 3D contoured surfaces PPS has developed calibration pods whereby the full object with mounted sensor is placed within the calibration pod, which is subsequently pressurized. This approach, in turn, results in the application of uniform pressure to every element across a complex surface.
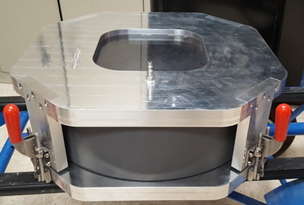
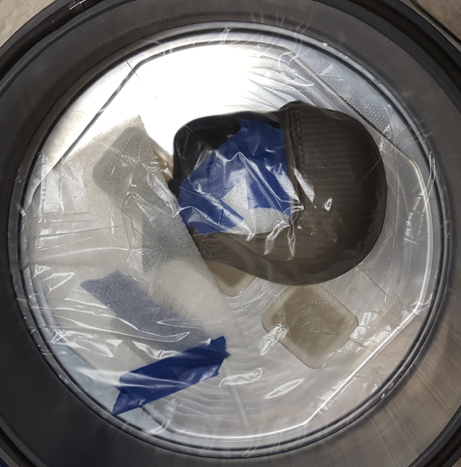
Figure 5 - Complex Surface Calibration Chamber
The calibration process can become even more complex yet, often defying the relatively simple notion that pressure equals force over area. Consider a wiper blade. When it’s in use, the shape of the blade and the point of contact between the blade and the windshield are not constant. As the blade moves across the glass, it can flatten and straighten. A sensor designed to verify the pressure applied by the blade must be able to accommodate the variable nature of that pressure; calibrating it with a uniform, static pressure, then, might not make sense. In such cases, devising a calibration method that mimics the actual use conditions—such as a robotic calibration fixture that presses down on a piece of the blade, making it slide as if it were in use—is preferable.
Though it can be tough to grasp and easy to oversimplify, the calibration process is a key part of developing capacitive tactile pressure sensor technology, and one that must not be overlooked.
Uncalibrated and Calibrated Tactile Arrays
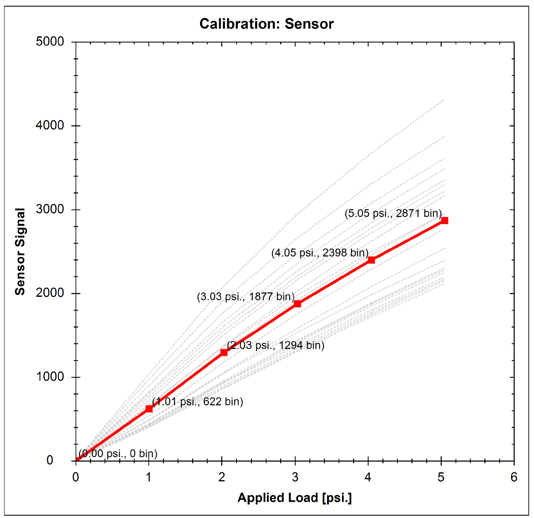
To begin the calibration process, the bladder is inflated to a known referenced uniform pressure and a calibration coefficient derived for each and every element of the sensor array. For example, if an applied pressure of 1 psi across an element results in an output of 1,000 counts, the calibration coefficient for that element is 1 psi per 1,000 counts. This figure is the key to converting raw sensor output into true pressure values and therefore when the output for each and every element across the array is multiplied by its own unique calibration coefficient, the result is the true pressure measured by each element.
Figure 6 a) shows the output plot against applied pressure load from a recently manufactured 1024 element array with desired FSR of 5 psi. The average output response of all 1024 elements is shown in red, with the individual responses of each and every 1024 elements shown in grey. It can be seen that the raw output varies from 2000 to 4000 counts across the different elements due to the aforementioned manufacturing tolerances.
After subsequent calibration (Fig 6 b)), the sensor features a uniform linear output response across all elements to applied load, whereby all the individual grey lines are now barely visible under average linear trace.

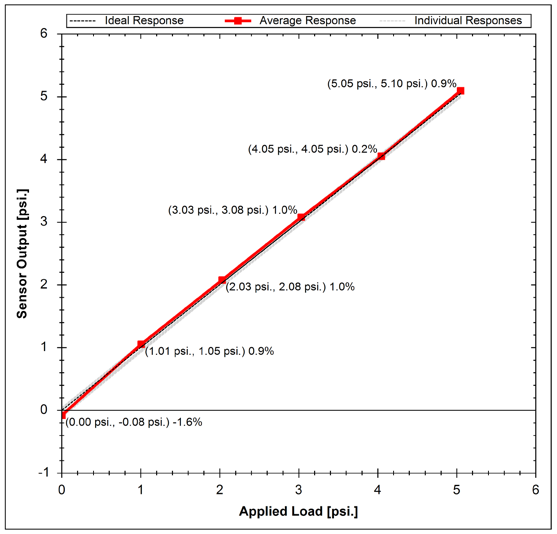
Figure 6: a) Uncalibrated Tactile Array Response, b) Calibrated Tactile Array Response
To linearize the uncalibrated sensor elements, the response curves of each element are approximated as a series of line segments and typically PPS’s calibration process features a five point calibration, whereby five distinct pressure loads from zero to desired FSR are applied across the sensor.
For verification, the sensor load is then cycled three times and the average response reported.
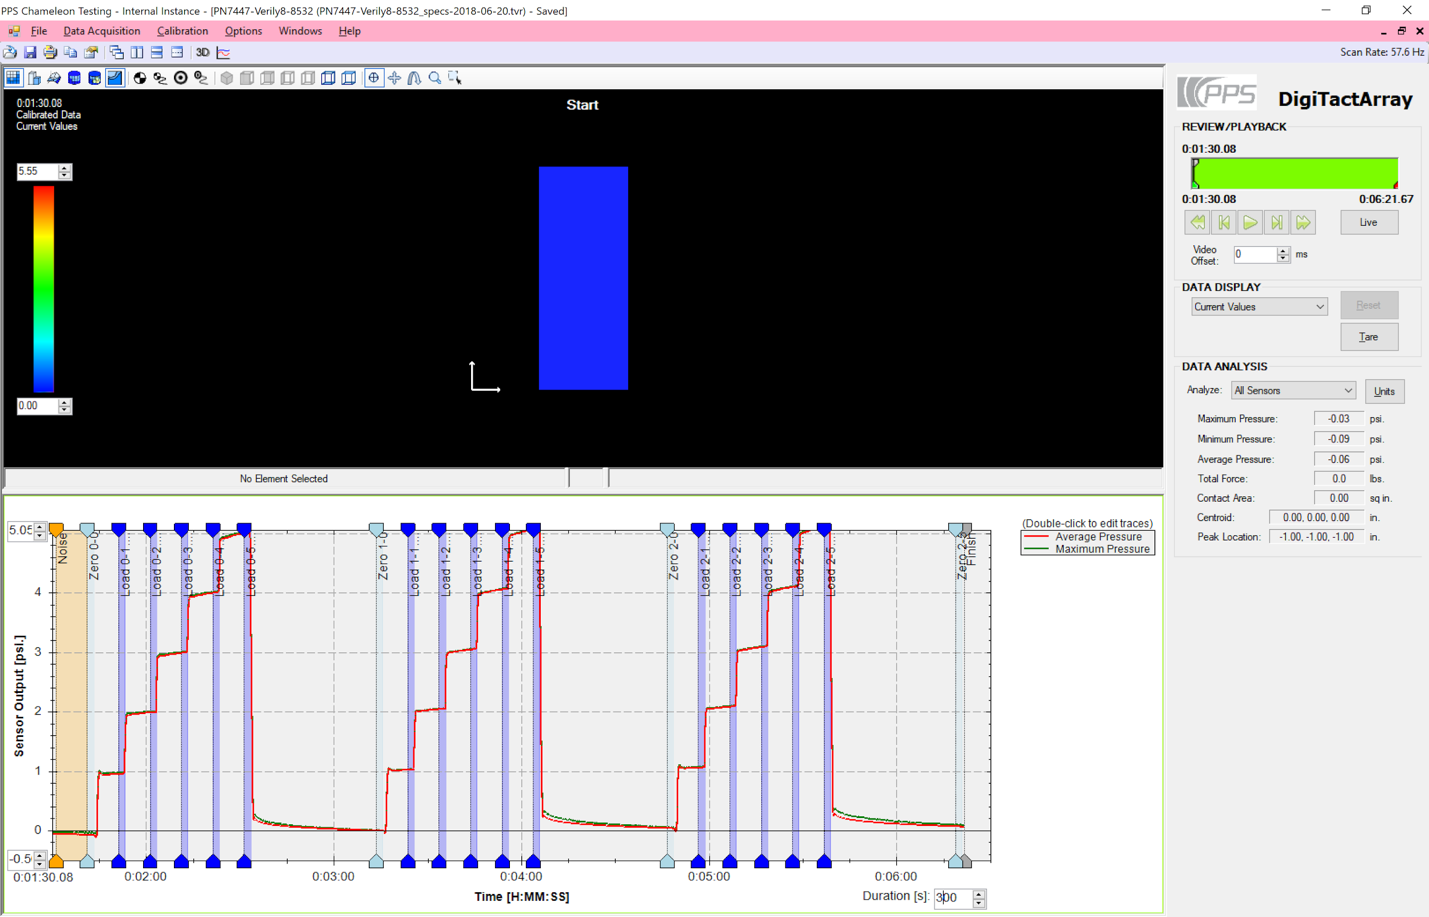
Figure 7: PPS Sensor Calibration Procedure - Pressure Cycling
The Calibration Output and Report
The first output of the calibration process is a plot (Figure 8) showing the uncalibrated sensor information, highlighting raw sensor output for each element against the applied load.

Figure 8: Uncalibrated Tactile Array Response Plot
The verification plot (Figure 9) shows calibrated output vs applied load. Since the verification is performed three times the system is able to report repeatability of the sensor.
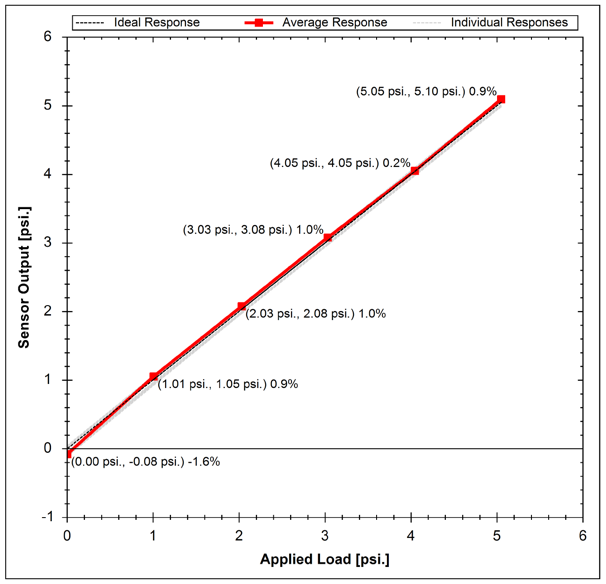
Figure 9: Calibrated Tactile Array Response Plot
A summary table provides key sensor performance characteristics including SNR, Gain repeatability, baseline repeatability linearity and resolution.
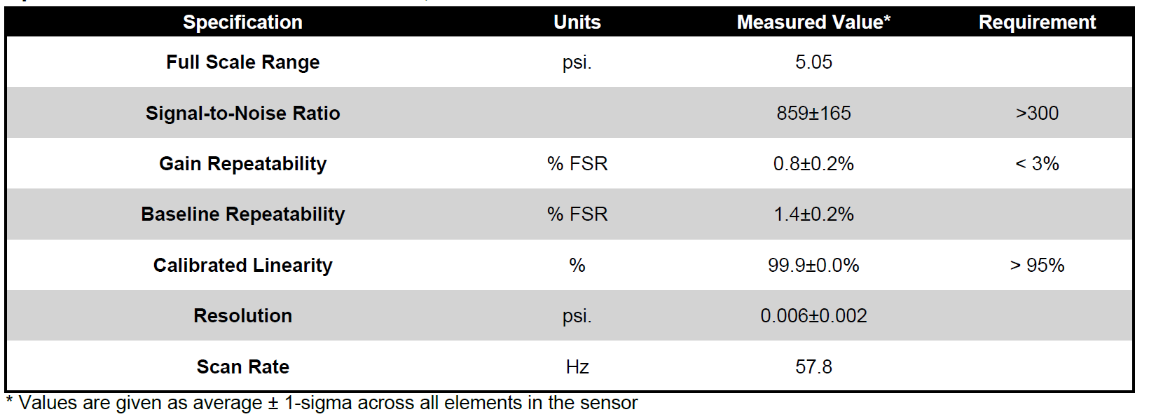
Figure 10: Key Calibrated Sensor Performance Metrics
Each PPS shipped array is supplied with the above key performance metrics.
Additional advanced information is also available highlighting the individual element responses. Figure 11 highlights the raw individual element responses an applied load.
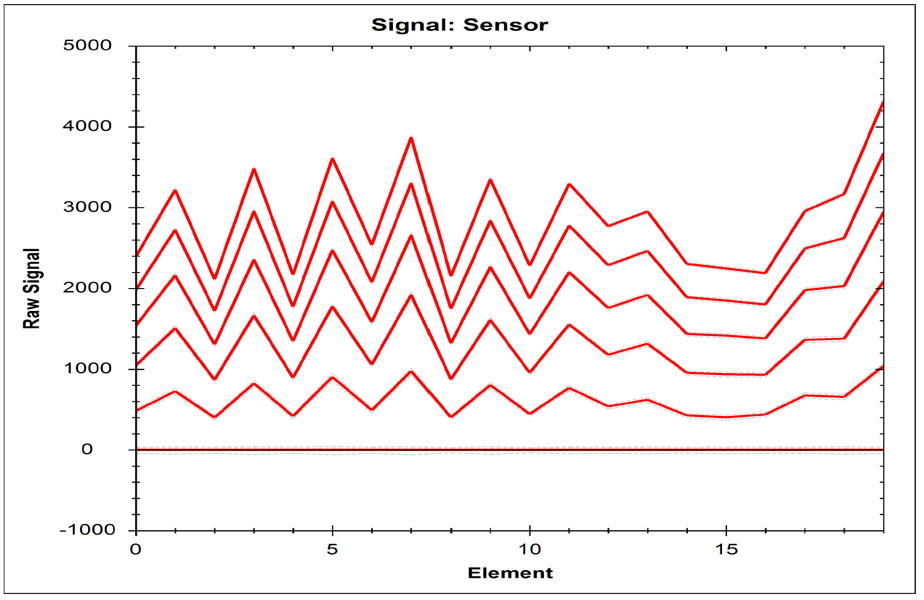
Figure 11: Raw Sensor Data Output
Statistical information on the repeatability of the elements is also summarized ins Figure 12.
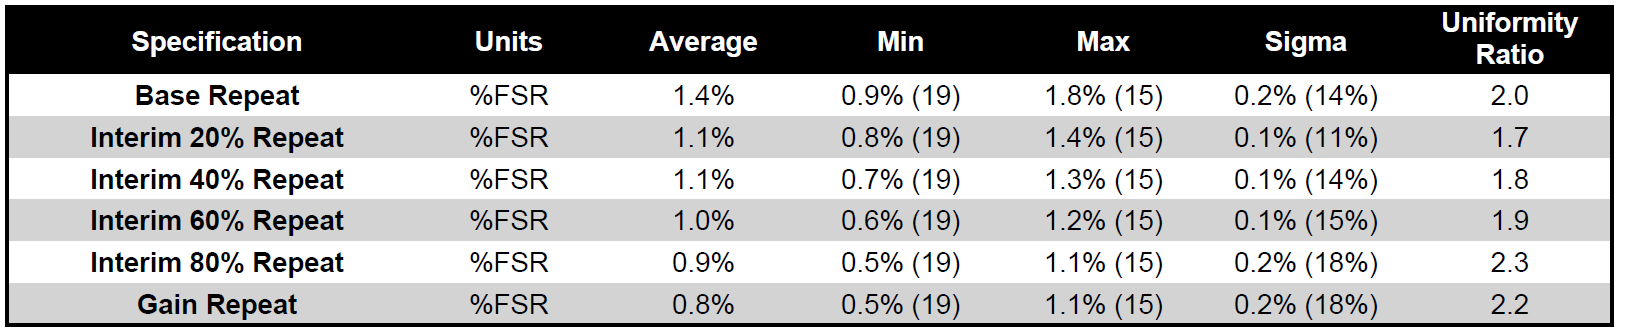
Figure 12: Sensor Repeatability