
Hand pressure distribution measurement for ergonomic research
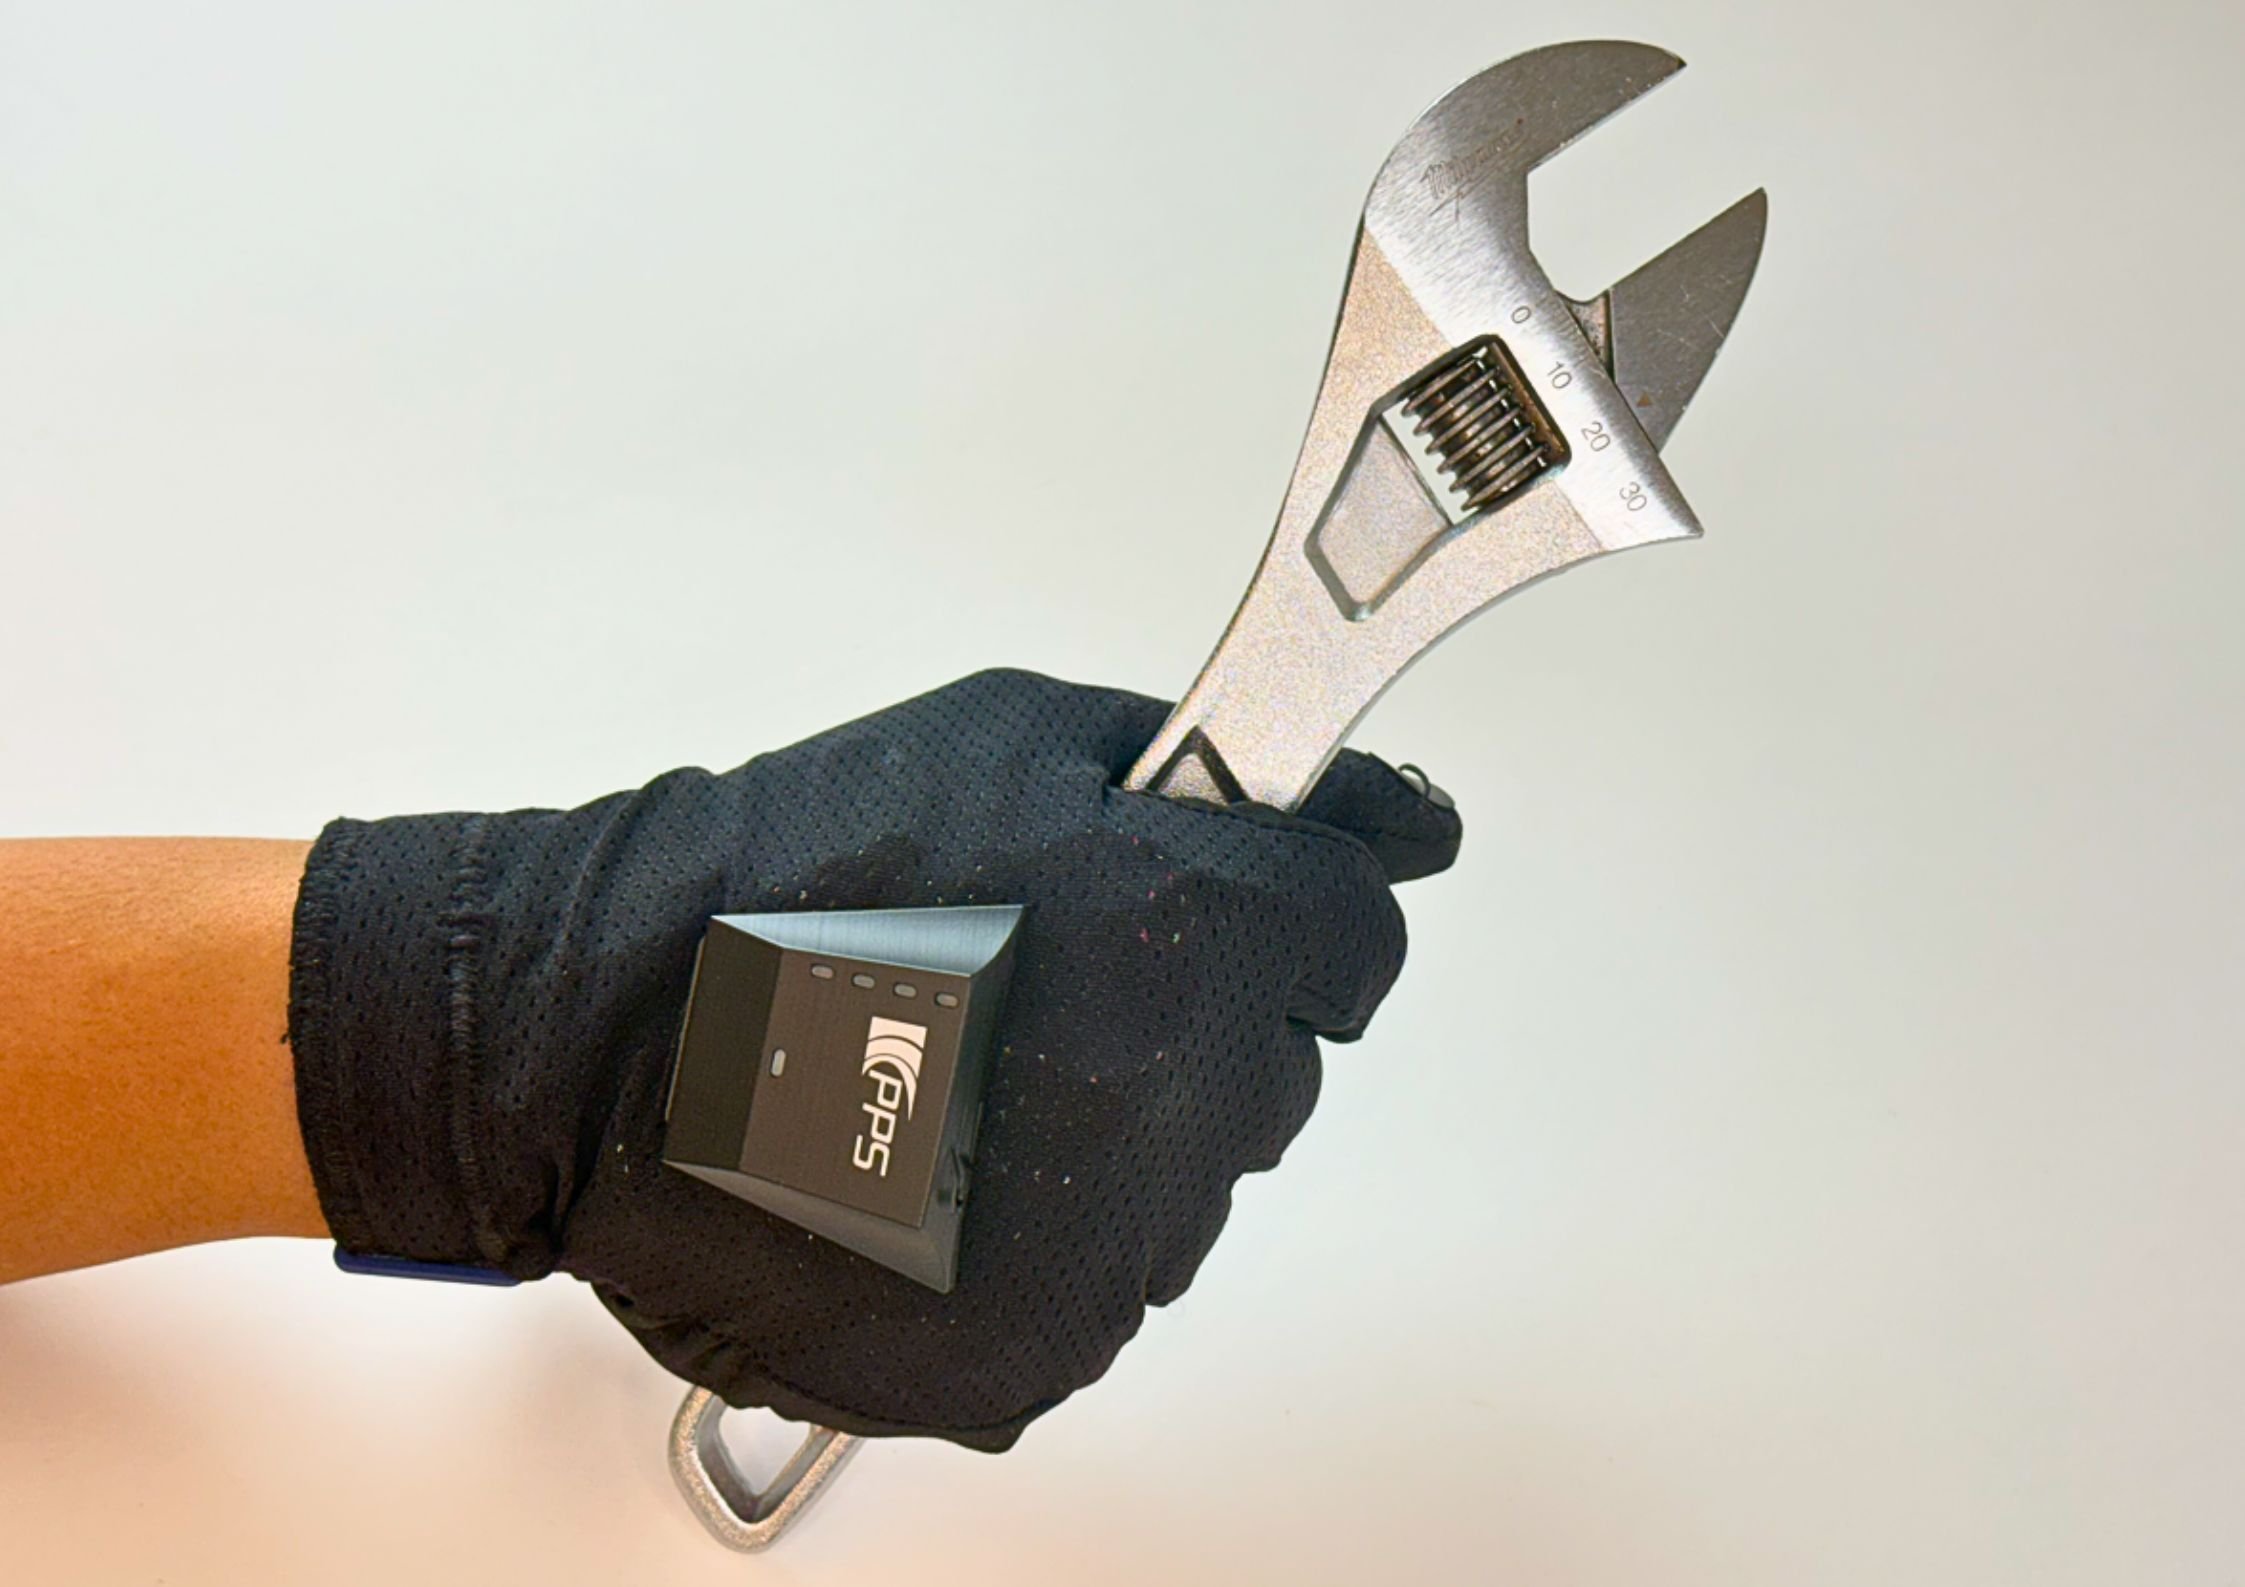
TactileGlove system worn during a gripping task, measuring hand pressure in real time.
Tactile sensing maps full-hand pressure across a task, not a single grip force reading.
You have observed the task, filmed it, and run the RULA. One worker says the grip hurts. Another says it is fine. The supplier insists the redesigned handle is better. Management wants evidence before approving the spend. Everything is in place except a number.
That gap - between what observation can show and what a safety case, a design decision, or a research paper actually requires - is where hand pressure distribution measurement changes the outcome. The ACGIH Hand Activity Level threshold limit values, revised in 2018 to better reflect carpal tunnel syndrome risk, require normalised peak force as an input. In most assessments, that value is estimated. Replacing the estimate with a direct measurement of hand forces during the actual task is what the standard was written to support.
Why hand grip force alone does not answer the question
A grip dynamometer measures how hard the human hand can squeeze. It produces one number, under a controlled condition that bears little resemblance to a four-hour assembly shift, a prototype comparison study, or a naturalistic task in a laboratory setting.
What it cannot show is where across the palm and fingers that force concentrates, how the distribution shifts as the task progresses, or whether a design change has moved load away from a vulnerable contact point. Two tools can produce identical grip force readings and completely different pressure distributions at the hand interface. The one concentrating load on the index finger over a long duty cycle carries a different injury risk to the one spreading it across the palm, even when peak forces appear comparable.
Pinch gauges and push/pull force gauges share the same limitation. They are scalar instruments built for a different question. Using them to determine whether Product B has better ergonomic design than Product A, whether a workstation change has reduced hand loading below the threshold limit value, or how pressure distribution changes across a rehabilitation programme asks them to do something they were not designed for.
The data that grip force cannot give you
Tactile pressure mapping captures normal force across every region of the hand simultaneously. Each sensor element returns a pressure value, building a spatial picture of forces across the palm, fingers and thumb in real time. Over a complete task cycle, that picture becomes a time-resolved dataset: where peak pressures occur, when in the cycle they appear, and how long they persist.
Two parameters emerge that observational assessment cannot produce. Contact pressure distribution shows how forces are shared or concentrated across the hand surface. Effort, the integral of total force across all sensor elements over the task duration, captures cumulative hand loading rather than just the peak moment.
Effort is the parameter that resolves the comparison problem. A reciprocating saw generates higher peak pressures than a manual saw, but the task duration is shorter and the area under the force-time curve is lower. An assessment based on peak pressure alone points to the wrong conclusion. When effort is plotted alongside peak force against HAL threshold limit values, the full risk picture becomes visible.
Where hand loading measurement applies
If the work involves a product or process where the human hand applies force to a surface, and whether that force is distributed safely, efficiently, or comparably across conditions matters - the measurement challenge is fundamentally the same. What changes is what the data needs to demonstrate.
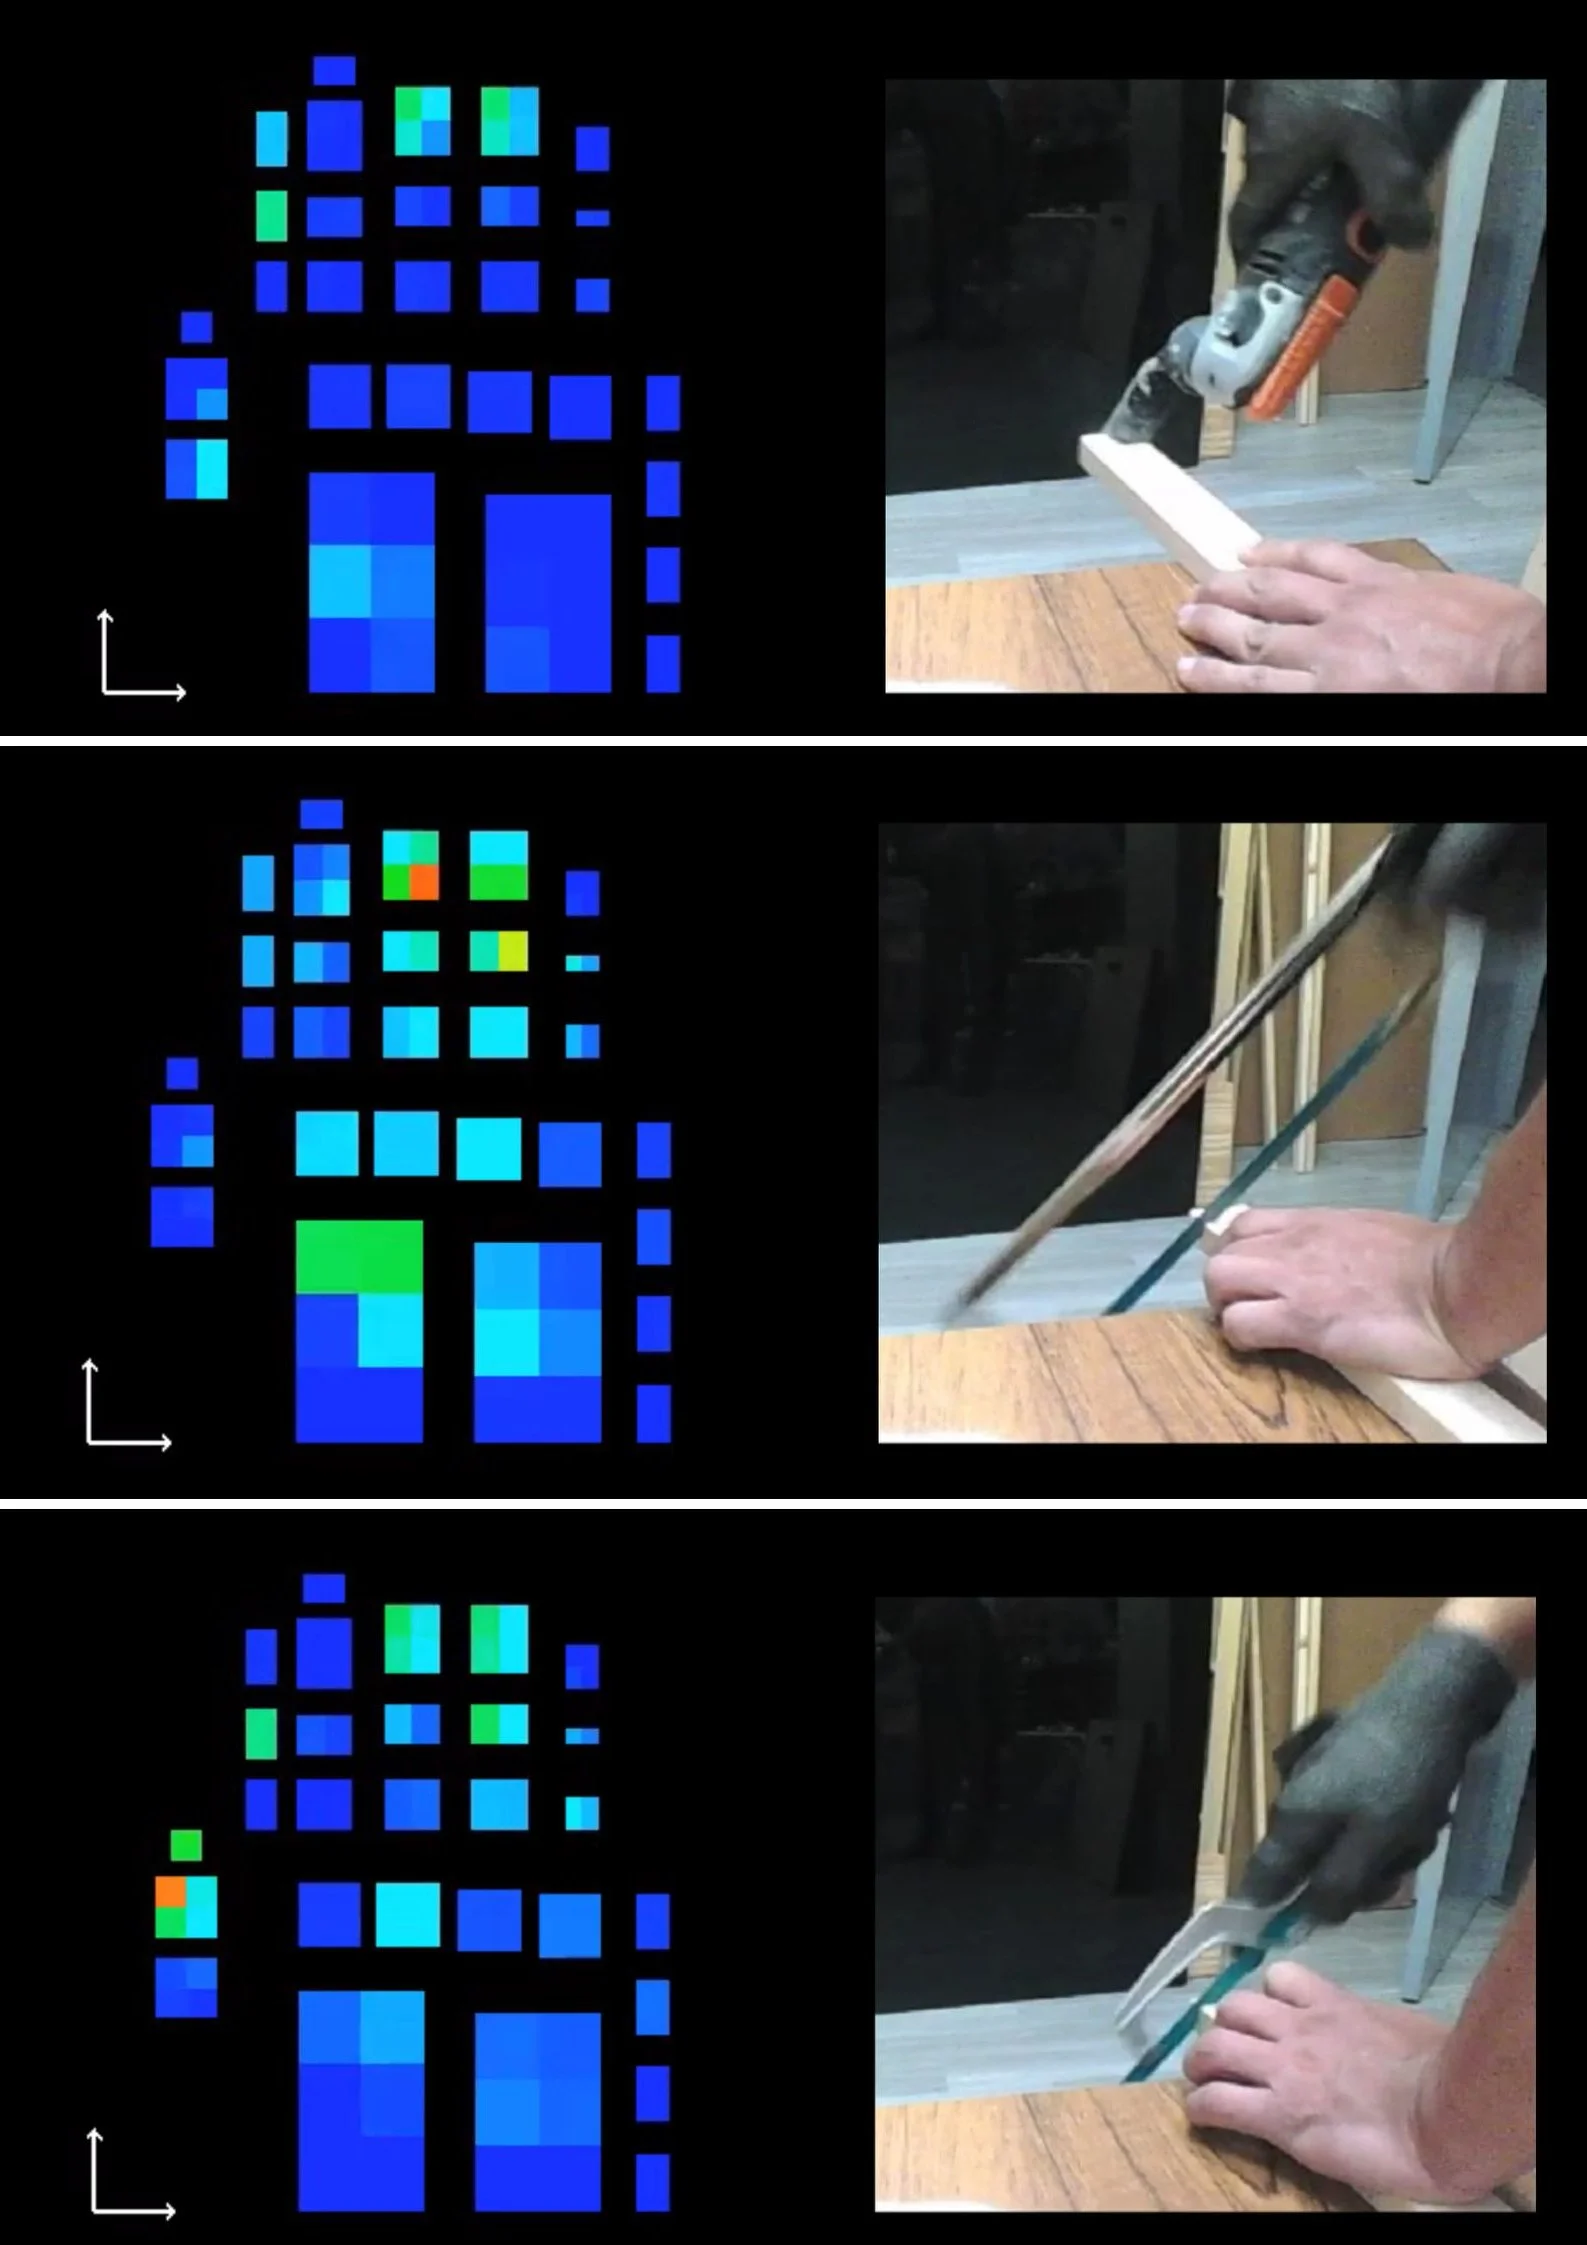
TactileGlove pressure data comparing hand force across an oscillating saw, hacksaw, and compact hacksaw — same task, different pressure profile.
Workplace ergonomic risk assessment and safety reporting
The complaint has been logged. The task has been observed. What the safety case now requires is a measured value, not a rating.
Wearable pressure mapping during the actual task captures hand forces as they occur, including peak pressure per digit, grip force across the palm, and effort across the task cycle, all referenced against HAL action limits. The data is repeatable, comparable before and after an intervention, and specific enough to challenge a supplier's claim or justify an engineering control to a safety committee.
Researchers at Purdue University, funded by NIOSH, validated this approach across 31 participants and over 2,700 lifting tasks. Their model, published in Applied Ergonomics, classified ergonomic risk with 89% accuracy using glove-based pressure data combined with postural analysis, establishing wearable pressure mapping as a credible occupational assessment instrument, not only a research tool.
Tool and handle design comparison
Three prototypes pass the engineering specification. User feedback is inconsistent and a costly tooling decision cannot rest on it.
Running a controlled task comparison across all three designs produces a dataset where differences are specific and visible. Does the foam handle reduce peak pressures on the fingers, or shift the load to the palm? Does the wider grip lower effort, or increase it because the task takes longer? Does the change that users describe as more comfortable actually correspond to a measurable redistribution of forces, or is the preference driven by something the pressure data reveals as unrelated to loading?
The TactileGlove white paper works through exactly this comparison across spreader handle designs, showing how contact area, digit force and peak pressure each respond differently to the same design change, and why peak pressure alone would have pointed to a different conclusion than the full dataset. The path from question to answer is short: define the task, run the comparison, export the data. No laboratory infrastructure required, no account manager between the engineering problem and the team working on it.
The approach has been applied in automotive human factors research to correlate grip data with design preference across driver populations: the same method, a different product context.
Research into hand function and biomechanics
The gap in existing methodology is not force measurement, it is spatial force measurement during real tasks. How forces are distributed during functional activity, how grip strategy adapts across a session, and whether a specific region of the hand carries disproportionate load in a way that correlates with injury or impaired performance, none of that is visible in a scalar measurement.
Time-resolved pressure mapping across the full hand surface is exported as raw pressure data in CSV format, compatible with MATLAB, Python or equivalent analytical environments. This provides the spatial dataset that functional research requires. The data stream is stable enough across repeated sessions that calibration does not become a confounding variable in study design - a practical consideration that scalar instruments rarely raise but wearable systems frequently do.
Purdue's research group trained machine learning models on TactileGlove data streams to predict lifting risk index, reaching R-squared values of 0.82 with shallow neural networks and an F1 score of 0.88 when combined with computer vision for postural data. Kyushu University applied the same platform to study touch skill assessment during dementia care movements. Dr Denny Yu, Associate Professor at Purdue's industrial engineering department, described the findings as opening "the door for smarter, scalable ergonomic assessments for improving workplace safety." Full methodology is in the Purdue-NIOSH success story.
PPS sensing systems for hand ergonomics
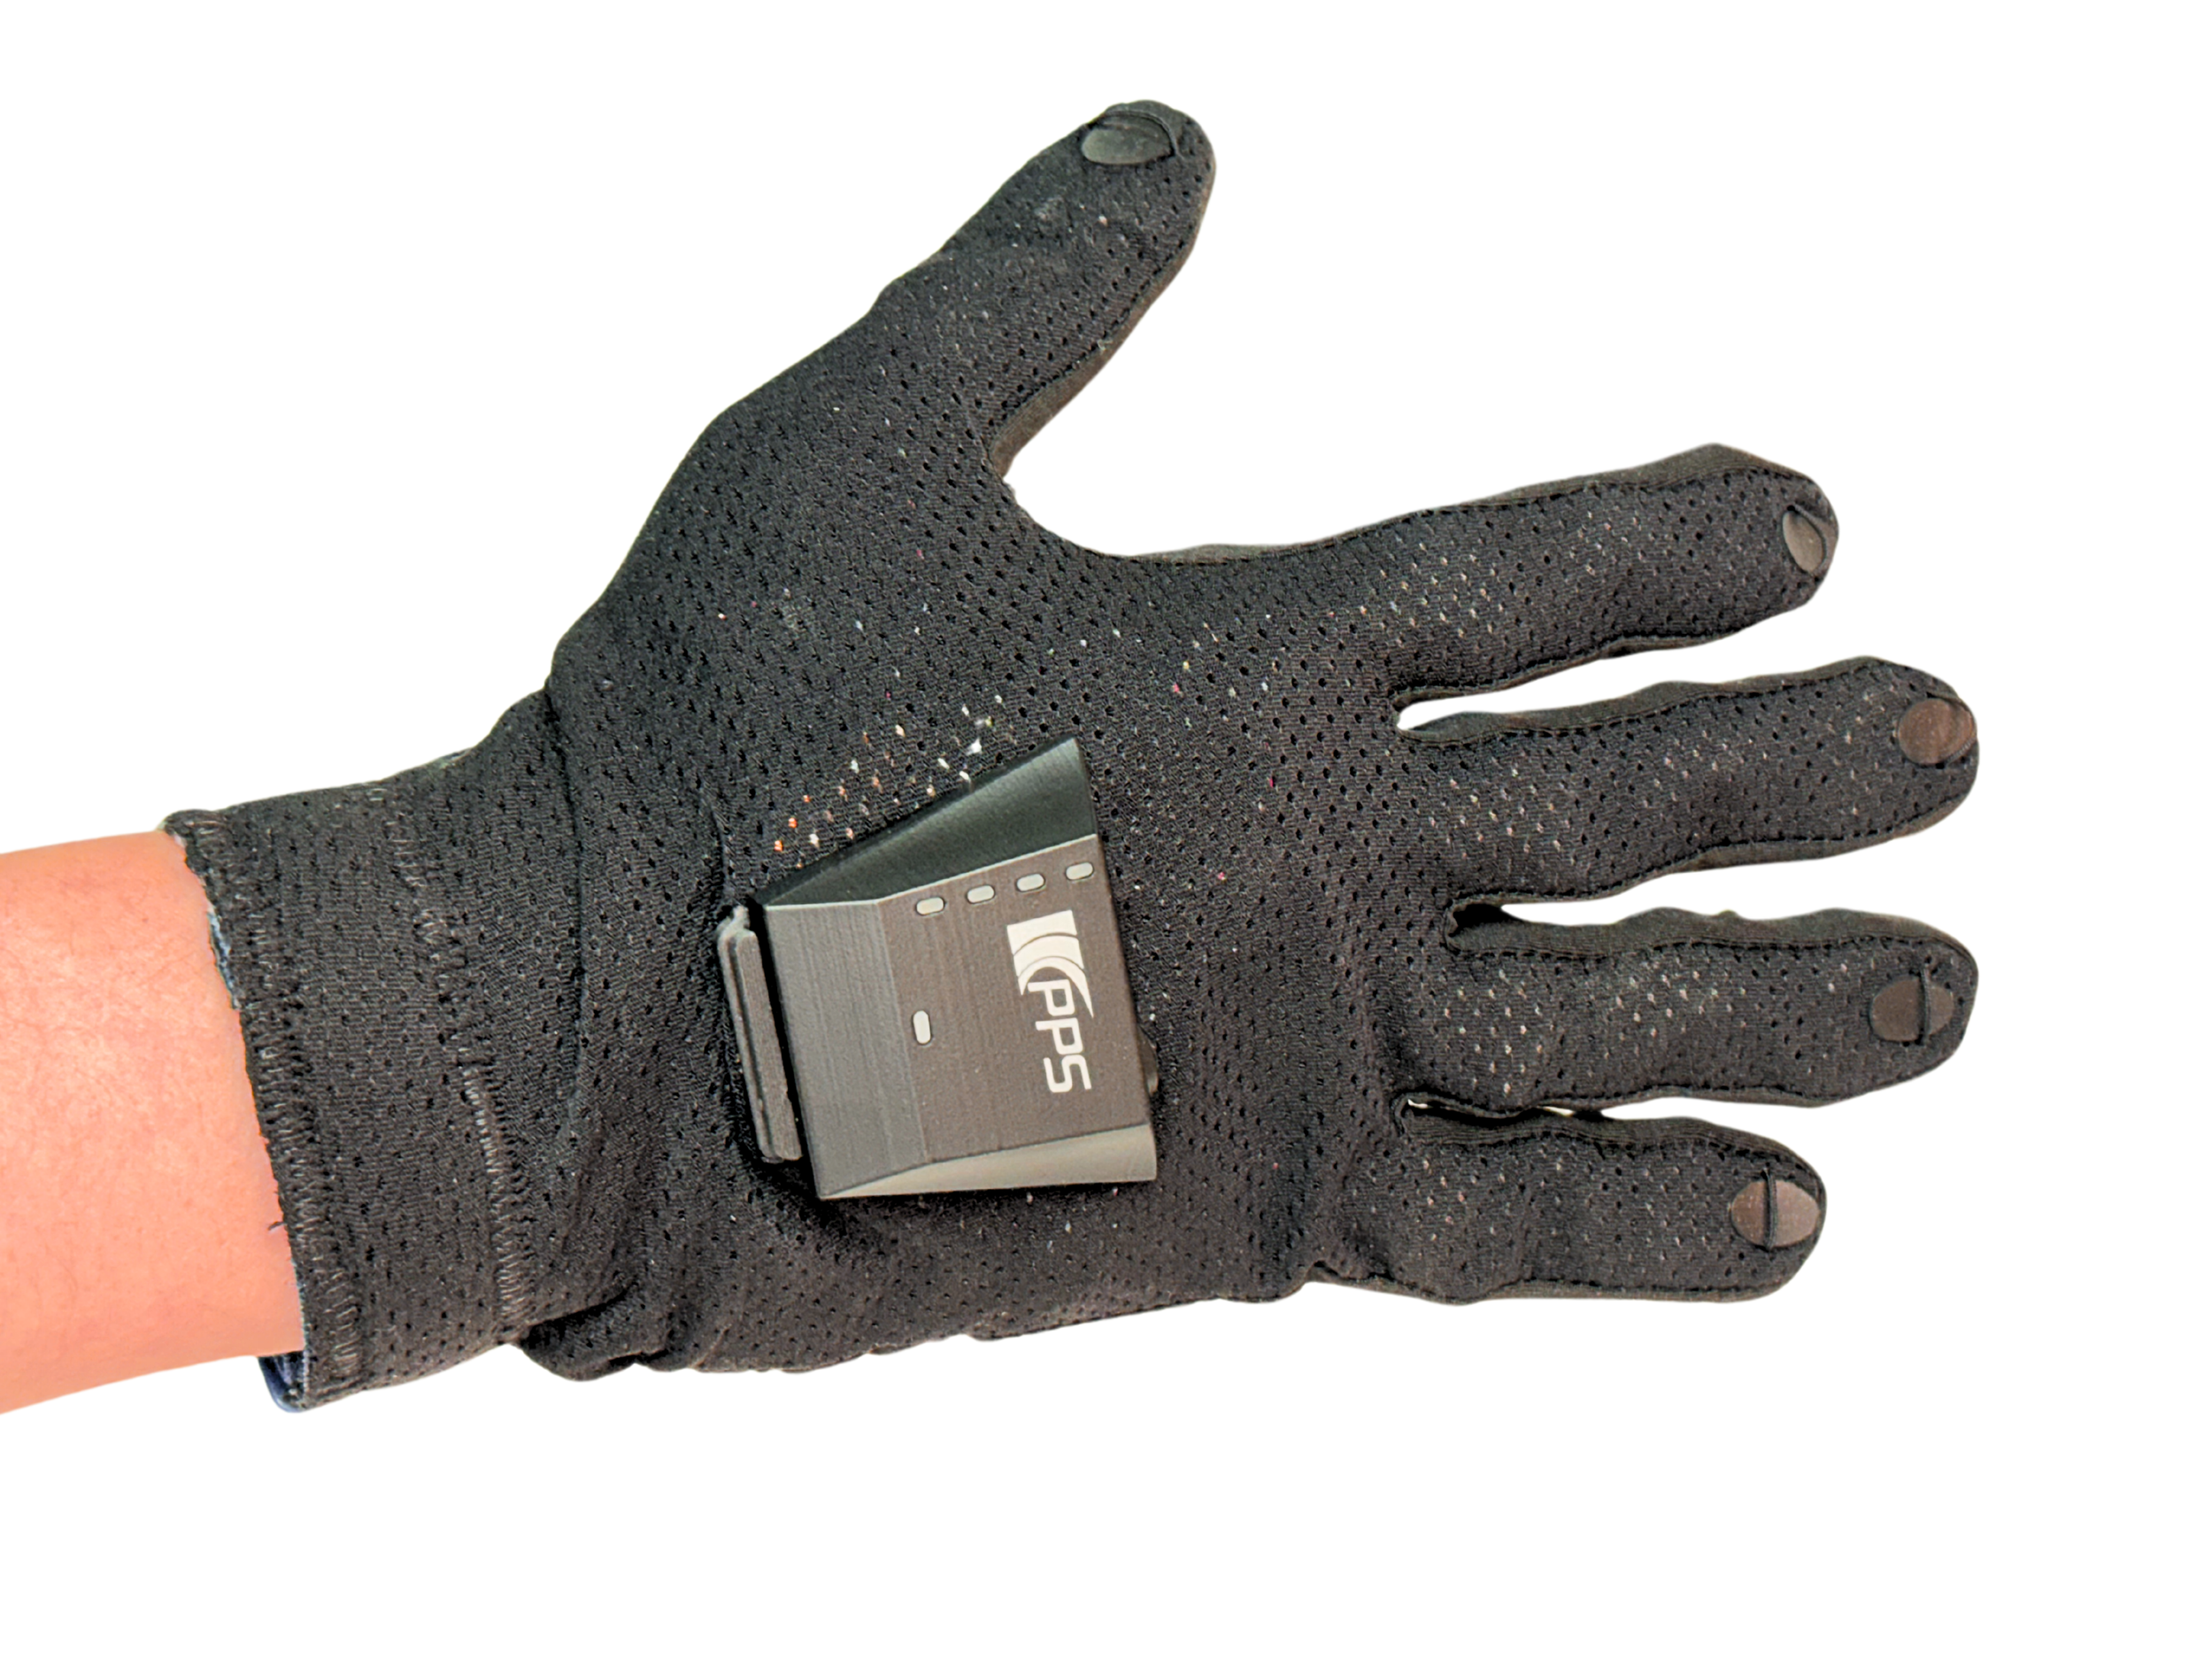
TactileGlove with 65 sensors
The TactileGlove provides full-hand pressure mapping across 65 sensor elements per glove, wireless, with real-time visualisation and data export for downstream analysis. It is the right instrument when the spatial distribution of forces across the whole hand matters, such as workplace assessment, handle comparison, or biomechanical research.
Where digit-specific measurement is needed without the full glove form factor, such as precision grip tasks, constrained product development environments, or research focused on individual digit loading, FingerTPS sensors cover the thumb and up to four fingers with a lighter wearable profile. The measurement principle is the same; the configuration fits the task.
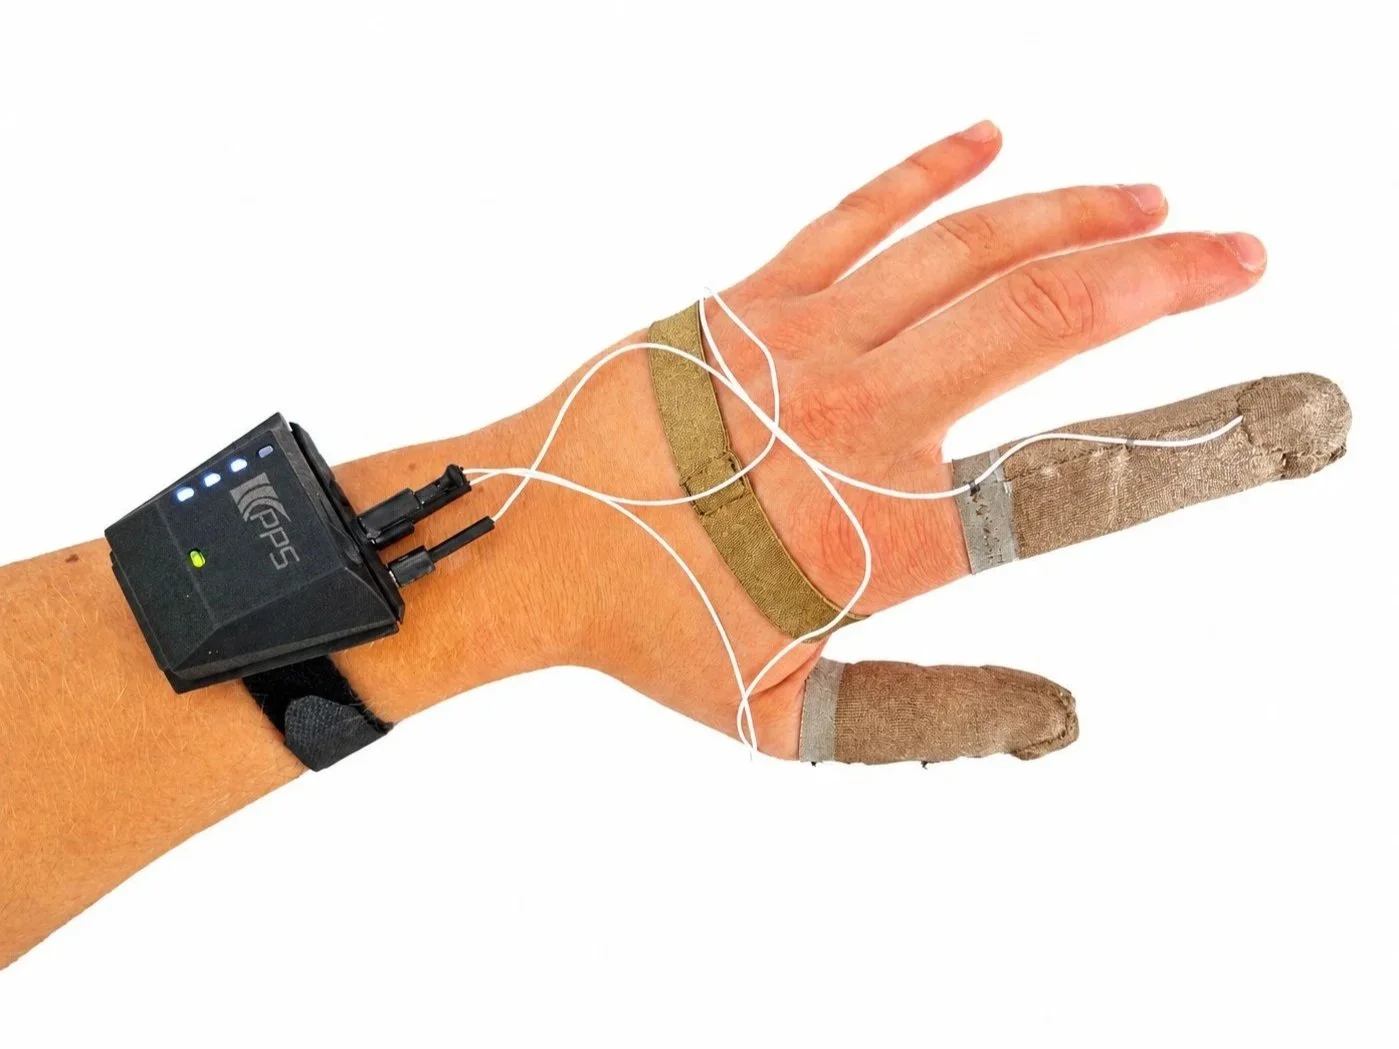
FingerTPS System with 3 sensors
Every project starts with an engineering problem. When a measurement protocol needs building around a specific task, or pressure data needs connecting to an existing assessment framework, the PPS engineering team works directly on that, no account manager in the chain.
Explore further
→ How tactile sensing works — Tactile sensing overview
→ Ready to discuss your application — Contact PPS